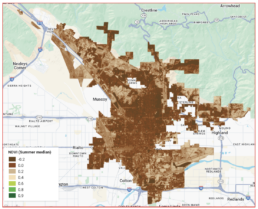
I. Heat Is Increasing — Almost Everywhere
The data are unambiguous.
Between 2000 and 2020:
-
206 of 207 block groups experienced an increase in summer land surface temperature.
-
Average land surface temperatures rose from 37.5°C to 41.4°C.
-
Average air temperatures increased from 32.3°C to 34.8°C.
-
Heat-wave duration expanded dramatically — from 4.6 days per year in 2000 to 16.8 days per year in 2020.
In short: summers are hotter, and extreme heat lasts longer.
Downtown San Bernardino and surrounding neighborhoods experienced some of the largest increases, particularly in areas with higher building density and reduced vegetation.
Heat is not isolated to a few hotspots — it reflects a citywide shift in baseline conditions.
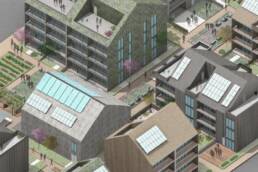
II. From Fields to Freeways: Urban Form Shapes Heat
San Bernardino’s transformation from agricultural landscape to industrial and car-oriented city has had thermal consequences.
Land use establishes the baseline conditions that shape heat behavior:
-
Surface materials (asphalt, roofing),
-
Building density,
-
Fragmented open space,
-
Declining vegetation cover.
Industrial corridors and transportation infrastructure concentrate heat-absorbing surfaces. Residential infill reduces small, dispersed green spaces. The result is an intensified urban heat island effect, especially in more densely built areas.
We found that block groups with higher building counts tend to experience larger increases in extreme heat days, a clear link between development intensity and local warming.
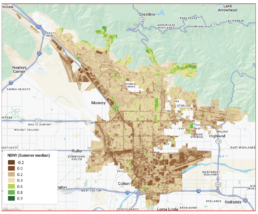
III. The Disappearing Cooling System: Vegetation Loss
One of the most striking findings is the scale of fine-grained vegetation loss.
Over the past two decades:
-
Most block groups lost more than 60% of vegetated area, particularly small, dispersed patches and linear greenbelts.
-
Standard land cover datasets underestimated this change, detecting only 20–30% loss because they miss patches smaller than ~4,000 square feet.
Using spectral unmixing techniques, we were able to detect sub-pixel vegetation: sparse street trees, roadside shrubs, and small green fragments that conventional datasets overlook.
These small spaces matter.
Their disappearance disproportionately increases exposure in residential neighborhoods.
IV. Heat Is Also Social
Heat exposure does not fall evenly across the city.
When we compared the top 25% most heat-exposed areas to the bottom 25%, clear disparities emerged:
-
Hispanic population share: 61.6% vs. 39.4%
-
Poverty rate: 26.8% vs. 6.4%
-
Adults without a high school diploma: 27.4% vs. 9.3%
-
Employment in vulnerable outdoor industries: 39.4% vs. 16.2%
-
Older housing stock (often lacking efficient cooling): 66.3% vs. 51.2%
Communities experiencing the greatest increase in extreme heat days are also more likely to face economic hardship, aging housing infrastructure, and outdoor employment exposure.
Heat, in this context, is not just meteorological.
It is spatial, structural, and social.
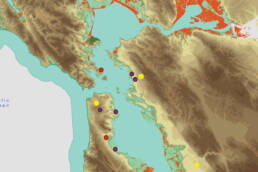
V. A Composite Heat Vulnerability Framework
To move beyond isolated indicators, we developed a heat vulnerability score combining:
-
Heat exposure (surface temperature, air temperature, extreme heat duration)
-
Adaptive capacity (vegetation, built environment characteristics)
-
Sensitivity (poverty, age, race/ethnicity, outdoor work, housing conditions)
The resulting map identifies clusters where rising exposure overlaps with declining adaptive capacity and high social sensitivity — areas where intervention is most urgent.
VI. Why This Matters for California Climate Adaptation
This project, funded by California’s LCI iCARP program, demonstrates how climate planning can move from general risk awareness to neighborhood-scale precision.
Three key lessons emerge:
-
Heat is accelerating at the neighborhood scale, not just citywide.
-
Small green spaces matter, and their loss is undercounted.
-
Equity must be central to adaptation planning, because the communities most exposed are also the least resourced.
As climate change intensifies, extreme heat will increasingly shape public health, infrastructure stress, housing stability, and economic vulnerability.
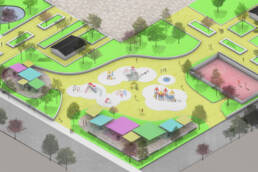
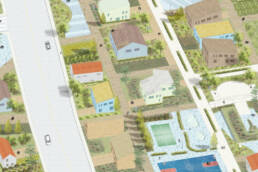
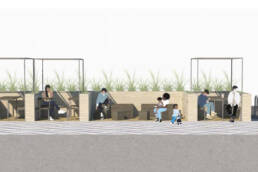
Targeted, place-based strategies such as urban greening, cool roofs, shade infrastructure, tree canopy restoration, and housing retrofits must prioritize neighborhoods where exposure and vulnerability intersect.
VII. Staying Cool, Staying Connected
Urban heat is not inevitable.
It is shaped by planning decisions, development patterns, and resource distribution.
By mapping exposure and vulnerability together, we can design interventions that are not only climate-responsive but equity-driven.
San Bernardino offers a powerful case study — and a call to action — for inland cities across California.
If you’d like, I can also:
-
Shorten this into a 600–800 word public-facing version,
-
Make a more policy-oriented version for state agencies,
-
Or write a more conceptual/theoretical version that frames heat as an artifact of urban form and political economy (which might align with your more process-oriented interests).